Transforma Insights’ TAM Forecasts provide our quantitative view of the market opportunity associated with Digital Transformation and all of the associated technologies. As part of this, our Connected Things (IoT) forecasts offer a highly granular analysis of the IoT market until 2032.
This page includes selected highlights from our IoT forecasts. The figures are regularly updated and are a live view of the forecast information contained in our Connected Things (IoT) forecast database. The figures available on this page are free to use on the condition that they are sourced to Transforma Insights.
Further information on Metrics and Use Cases and Applications included in the Connected Device (IoT) forecast database is included lower down this page. Corporate subscribers have full access to these forecasts via our TAM Forecasts page. For more information about subscribing to Transforma Insights please see an Overview of our Services or contact sales@transformainsights.com.
[Last Updated: 30-Jul-26]
The installed base of IoT connections will grow rapidly over the decade to 2030. Transforma Insights defines IoT connections as connections to remote sensing and actuating devices, and we include associated aggregation devices.
| Chart Data (billion) | 2024 | 2025 | 2026 | 2027 | 2028 | 2029 | 2030 | 2031 | 2032 | 2033 | 2034 | 2035 |
|---|---|---|---|---|---|---|---|---|---|---|---|---|
| ■ IoT Connections | 19.0 | 21.2 | 23.4 | 25.7 | 28.2 | 30.7 | 33.4 | 36.1 | 38.9 | 41.9 | 45.0 | 48.2 |
[Last Updated: 30-Jul-26]
The sheer addressable size of the consumer market results in consumer devices dominating the forecasts in 2030, including devices such as connected televisions and smart watches. Vertical-specific markets are far more fragmented, but also include smart metering applications which account for significant numbers of connections. Cross-vertical (enterprise) markets include vertical-agnostic applications such as connected heating ventilation and air conditioning systems and connected security systems deployed in an enterprise context. Greater China is the largest region, closely followed by Europe and North America.
| Chart Data (billion) | Greater China | Europe | North America | Japan | Latin America | India & South Asia | South East Asia | MENA | South Korea | Russia & Central Asia | Australasia | Sub-Saharan Africa |
|---|---|---|---|---|---|---|---|---|---|---|---|---|
| ■ Vertical-specific | 3.92 | 3.56 | 3.28 | 1.12 | 0.62 | 0.77 | 0.45 | 0.35 | 0.29 | 0.25 | 0.25 | 0.26 |
| ■ Cross-vertical | 2.33 | 1.01 | 1.07 | 0.29 | 0.28 | 0.18 | 0.13 | 0.16 | 0.14 | 0.11 | 0.08 | 0.06 |
| ■ Consumer | 8.45 | 5.64 | 5.58 | 1.50 | 1.50 | 1.10 | 0.92 | 0.84 | 0.50 | 0.57 | 0.39 | 0.27 |
[Last Updated: 30-Jul-26]
The installed base of cellular connected IoT devices will grow to around 5 billion by 2030. In the later years of the forecast, connection numbers will be dominated by 5G mMTC (massive Machine Type Communications, which includes the NB-IoT and LTE-M technologies) and 4G, driven to a great extent by 2G and 3G network switch-off.
| Chart Data (billion) | 2024 | 2025 | 2026 | 2027 | 2028 | 2029 | 2030 | 2031 | 2032 | 2033 | 2034 | 2035 |
|---|---|---|---|---|---|---|---|---|---|---|---|---|
| ■ 5G mMTC* | 0.73 | 0.93 | 1.16 | 1.39 | 1.65 | 1.92 | 2.21 | 2.51 | 2.82 | 3.13 | 3.46 | 3.80 |
| ■ 5G non-mMTC | 0.04 | 0.06 | 0.10 | 0.14 | 0.21 | 0.30 | 0.42 | 0.57 | 0.75 | 0.95 | 1.18 | 1.43 |
| ■ 4G | 1.02 | 1.17 | 1.31 | 1.45 | 1.55 | 1.62 | 1.67 | 1.69 | 1.69 | 1.65 | 1.60 | 1.53 |
| ■ 3G | 0.02 | 0.01 | 0.01 | 0.00 | 0.00 | 0.00 | 0.00 | 0.00 | 0.00 | 0.00 | 0.00 | 0.00 |
| ■ 2G | 0.24 | 0.21 | 0.18 | 0.16 | 0.13 | 0.11 | 0.08 | 0.06 | 0.03 | 0.03 | 0.02 | 0.02 |
*5G mMTC includes antecedent 4G technologies NB-IoT and LTE-M
[Last Updated: 30-Jul-26]
Annual shipments of devices that will be deployed on dedicated private networks will grow quickly during the period to 2030. NB-IoT and LTE-M technologies which have been rebadged as mMTC (massive Machine Type Communications) will dominate, with the adoption of higher bandwidth 5G (non-mMTC) options benefitting from the resulting preponderance of 5G private networks. Additionally, 5G services offer increased flexibility and functionality compared to 4G in a private network context.
| Chart Data (million) | 2024 | 2025 | 2026 | 2027 | 2028 | 2029 | 2030 | 2031 | 2032 | 2033 | 2034 | 2035 |
|---|---|---|---|---|---|---|---|---|---|---|---|---|
| ■ Unit Sales Private 5G non-mMTC | 1.0 | 1.5 | 2.3 | 3.6 | 5.5 | 7.9 | 10.4 | 12.3 | 14.4 | 16.8 | 19.5 | 22.6 |
| ■ Unit Sales Private 5G mMTC | 1.6 | 2.7 | 4.0 | 5.5 | 7.6 | 10.2 | 13.5 | 17.2 | 21.7 | 26.8 | 33.0 | 40.2 |
| ■ Unit Sales Private 4G | 4.9 | 5.7 | 6.1 | 6.8 | 7.5 | 8.2 | 8.4 | 8.8 | 9.0 | 8.7 | 8.0 | 6.9 |
[Last Updated: 30-Jul-26]
Low Power Wide Area (LPWA) connections will grow to dominate the market for wide-area wireless IoT connectivity in the second half of the decade. 5G mMTC (massive Machine Type Connectivity), which comprises NB-IoT and LTE-M, will prevail in a public network context, whilst non-mMTC technologies such as LoRaWAN will lead in a private network context.
| Chart Data (billion) | 2024 | 2025 | 2026 | 2027 | 2028 | 2029 | 2030 | 2031 | 2032 | 2033 | 2034 | 2035 |
|---|---|---|---|---|---|---|---|---|---|---|---|---|
| ■ Public Network - 5G (mMTC) | 0.73 | 0.93 | 1.15 | 1.38 | 1.63 | 1.89 | 2.17 | 2.46 | 2.75 | 3.04 | 3.35 | 3.66 |
| ■ Private Network - 5G (mMTC) | 0.00 | 0.01 | 0.01 | 0.01 | 0.02 | 0.03 | 0.04 | 0.05 | 0.07 | 0.09 | 0.11 | 0.14 |
| ■ Public Network - LPWA (non-mMTC) | 0.14 | 0.17 | 0.21 | 0.25 | 0.30 | 0.36 | 0.42 | 0.48 | 0.54 | 0.61 | 0.68 | 0.74 |
| ■ Private Network - LPWA (non-mMTC) | 0.25 | 0.33 | 0.41 | 0.50 | 0.59 | 0.68 | 0.78 | 0.87 | 0.97 | 1.06 | 1.15 | 1.24 |
[Last Updated: 30-Jul-26]
The chart below reflects recurring IoT revenues associated with a range of enterprise verticals. Government, Retail & Wholesale and Transportation & Storage sectors will represent the greatest IoT revenue opportunities, although with relatively lower growth rates.
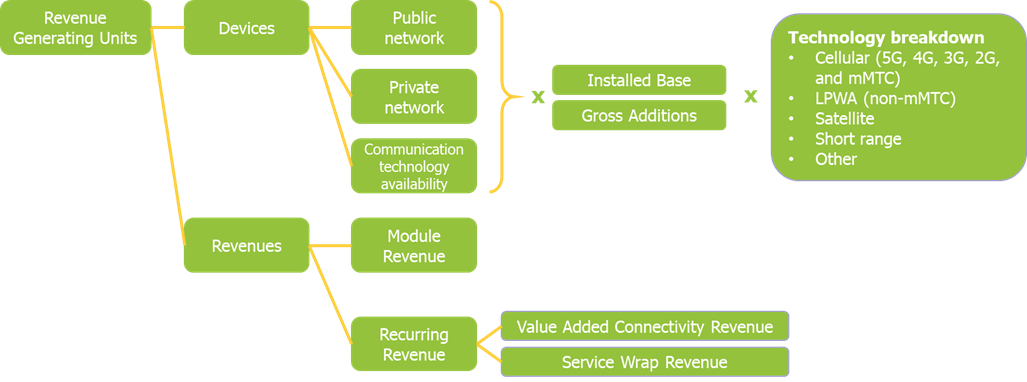
Below is an overview of all of the metrics available within the Connected Things forecast. Device counts are available in installed base and gross additions figures, broken up into public and private network and further into the relevant communication technology. The database can be searched for devices categorised either by their highest revenue technology, or by the availability of communications technologies as secondary connections. Revenue figures for Modules, Value Added Connectivity and Service Wrap are also available.
The connected things forecasts are built from the bottom-up, covering three Families (Machine-to-Person, Autonomous Systems and Smart Environment), 27 Use Cases and 69 Application Groups.
| Use Case | Application Groups |
|---|---|
| Machine-to-Person | |
| Connected Vehicles | eCall, Road Fleet Management, In-Vehicle Infotainment, In-Vehicle Navigation, Roadside Assistance, Stolen Vehicle Recovery, Usage-Based Insurance, Vehicle Diagnostics, Vehicle Head Unit, Vehicle Rental, Leasing & Sharing Management, Road Public Transport, Air Transport, Sea & River Transport, Rail Transport |
| Consumer Internet & Media Devices | Personal Portable Electronics, Smart Home, AV Equipment |
| IT Infrastructure | IT Infrastructure |
| Office Equipment | IT Equipment, Other Office Equipment |
| Payment Terminals | ATMs, Payment Processing, Vending Machines |
| Personal Assistance Robots | Personal Assistance Robots |
| Personal Monitoring & Tracking | Child & Pet Tracking, Security Tracking , Assisted Living, Healthcare Monitoring, Worker Safety, Telemedicine |
| Portable Information Terminals | Portable Information Terminals |
| White Goods | White Goods |
| Autonomous Systems | |
| Asset Tracking & Monitoring | Asset Monitoring, Bike Sharing, Container Tracking, Loss Prevention, Track & Trace, Waste Management |
| Autonomous Vehicles | Autonomous Road Vehicles, Drones, Retail Delivery Robots |
| Inventory Management & Monitoring | Inventory Management & Monitoring |
| Precision Specialist Robot | Precision Specialist Robot |
| Remote Diagnostics & Maintenance | Remote Diagnostics & Maintenance |
| Remote Process Control | Remote Process Control |
| Real World 'Visualisation' | Connected Glasses |
| Smart Grid | Generation, Grid Operations, Electric Vehicle Charging, Electricity Smart Meters, Gas Smart Meters, Water Smart Meters |
| Smart Environment | |
| Access Control & Intercoms | Access Control & Intercoms |
| Building Automation | Building Automation |
| CCTV | CCTV |
| Environmental Monitoring | Agriculture, Environment Monitoring, Infrastructure Monitoring |
| HVAC | HVAC |
| Lighting | Building Lighting, Public Space Lighting |
| Parking Space Monitoring | Parking Space Monitoring |
| Public Information & Advertising Screens | Public Information & Advertising Screens |
| Road Infrastructure Monitoring & Control | Road Traffic Control, Road Traffic Monitoring |
| Security & Fire Alarms | Security & Fire Alarms |
Our forecasts are developed at a national level, meaning all of our data is available for 196 different countries. These countries are grouped into 12 regions, based on proximity and market uniqueness.
| Region | Definition | Countries included |
|---|---|---|
| Australasia | Australia, New Zealand and Pacific Islands. | Australia, Fiji, Kiribati, Marshall Islands, Micronesia, Nauru, New Zealand, Palau, Samoa, Solomon Islands, Tonga, Tuvalu, Vanuatu |
| Europe | All countries west of Russia, including Israel and Turkey. | Albania, Andorra, Armenia, Austria, Azerbaijan, Belarus, Belgium, Bosnia and Herzegovina, Bulgaria, Croatia, Cyprus, Czech Republic, Denmark, Estonia, Finland, France, Georgia, Germany, Greece, Hungary, Iceland, Ireland, Israel, Italy, Kosovo, Latvia, Liechtenstein, Lithuania, Luxembourg, Malta, Moldova, Monaco, Montenegro, Netherlands, North Macedonia, Norway, Poland, Portugal, Romania, San Marino, Serbia, Slovakia, Slovenia, Spain, Sweden, Switzerland, Turkey, Ukraine, United Kingdom |
| Greater China | Solely China and Taiwan. | China, Taiwan |
| India and South Asia | India plus surrounding countries. | Bangladesh, Bhutan, India, Maldives, Nepal, Sri Lanka |
| Japan | Solely Japan. | Japan |
| Latin America | South and Central America and Caribbean. | Antigua and Barbuda, Argentina, Bahamas, Barbados, Belize, Bolivia, Brazil, Chile, Colombia, Costa Rica, Cuba, Dominica, Dominican Republic, Ecuador, El Salvador, Grenada, Guatemala, Guyana, Haiti, Honduras, Jamaica, Mexico, Nicaragua, Panama, Paraguay, Peru, Saint Kitts and Nevis, Saint Lucia, Saint Vincent and the Grenadines, Suriname, Trinidad and Tobago, Uruguay, Venezuela |
| MENA | Middle East and North Africa. Countries in West Asia, and Africa north of the Sahara Desert. | Algeria, Bahrain, Egypt, Iran, Iraq, Jordan, Kuwait, Lebanon, Libya, Morocco, Oman, Pakistan, Palestine, Qatar, Saudi Arabia, Syria, Tunisia, United Arab Emirates, Yemen |
| North America | Solely US and Canada. | Canada, United States of America |
| Russia & Central Asia | Eurasian countries comprising Russia, Central Asia and other proximate countries. | Afghanistan, Kazakhstan, Kyrgyzstan, Mongolia, North Korea, Russia, Tajikistan, Turkmenistan, Uzbekistan |
| South East Asia | Asian countries south of China, east of India. | Brunei, Cambodia, Indonesia, Laos, Malaysia, Myanmar, Papua New Guinea, Philippines, Singapore, Thailand, Timor-Leste, Vietnam |
| South Korea | Solely South Korea. | South Korea |
| Sub-Saharan Africa | All countries in Africa south of the Sahara Desert. | Angola, Benin, Botswana, Burkina Faso, Burundi, Cameroon, Cape Verde, Central African Republic, Chad, Comoros, Congo, Democratic Republic of the, Congo, Republic of the, Cote d'Ivoire, Djibouti, Equatorial Guinea, Eritrea, Eswatini, Ethiopia, Gabon, Gambia, Ghana, Guinea, Guinea-Bissau, Kenya, Lesotho, Liberia, Madagascar, Malawi, Mali, Mauritania, Mauritius, Mozambique, Namibia, Niger, Nigeria, Rwanda, Sao Tome and Principe, Senegal, Seychelles, Sierra Leone, Somalia, South Africa, South Sudan, Sudan, Tanzania, Togo, Uganda, Zambia, Zimbabwe |
For any further questions about Transforma Insights detailed IoT market forecasts, please contact us.